
Pharma brands don’t lack data — they lack direction. Budgets pour into Veeva emails, HCP media, webinars, rep calls, hubs, and SPP/claims feeds, while dashboards pile up impressions and clicks that rarely predict new starts. This article cuts straight to the five metrics that do: Qualified HCP Reach & Frequency, Omnichannel Engagement Quality (OEQ), Incremental Rx Lift, Time-to-Therapy & Early Persistency, and Cost per Qualified Action with LTV:CAC. For each, you’ll get a plain-English definition, a workable formula, the right data sources, common pitfalls, and — most importantly — what to do Monday morning. Measured well (and compliantly), these five turn your reporting from wallpaper into a weekly operating system for growth.
Key Takeaways
- Qualified HCP Reach & Frequency — Who you actually reached in-target (and with permission), and how often.
Use it to: Close coverage gaps, tune frequency, protect opt-ins. - Omnichannel Engagement Quality (OEQ) — A weighted score of meaningful actions (not vanity clicks).
Use it to: Promote high-yield content and next-best-actions. - Incremental Rx Lift (NBRx/TRx) — Causal impact from test-vs-control or holdouts.
Use it to: Reallocate budget to tactics that truly move scripts.


- Time-to-Therapy (TtT) & Early Persistency — Days to first fill + 30/60/90-day refill stickiness.
Use it to: Remove PA/copay friction and sequence support. - Cost per Qualified Action (CPQA) & LTV:CAC — Cost to generate predictive actions and long-term payback.
Use it to: Shift spend to channels with outcomes-level efficiency.
Why “Data-Driven” Is Different in Pharma
Pharma marketing is a multi-actor, regulated maze: HCPs, patients, payers, pharmacies, hubs — with lagged, restricted data. What looks like a simple funnel in retail becomes a lattice with consent rules and MLR scrutiny.
Key realities:
- Consent first. Growth in opted-in, permissioned audiences is a prerequisite for everything else.
- Fragmented stack. Veeva/Salesforce CRM, consent & preference centers, web/app analytics, email/SMS, event tech, paid media platforms, SPP/claims, hub and copay data, BI — often without a single ID spine.
- Measure incrementality, not exposure. Activity ≠ impact. Add holdouts whenever possible, and time-align marketing events with outcomes.

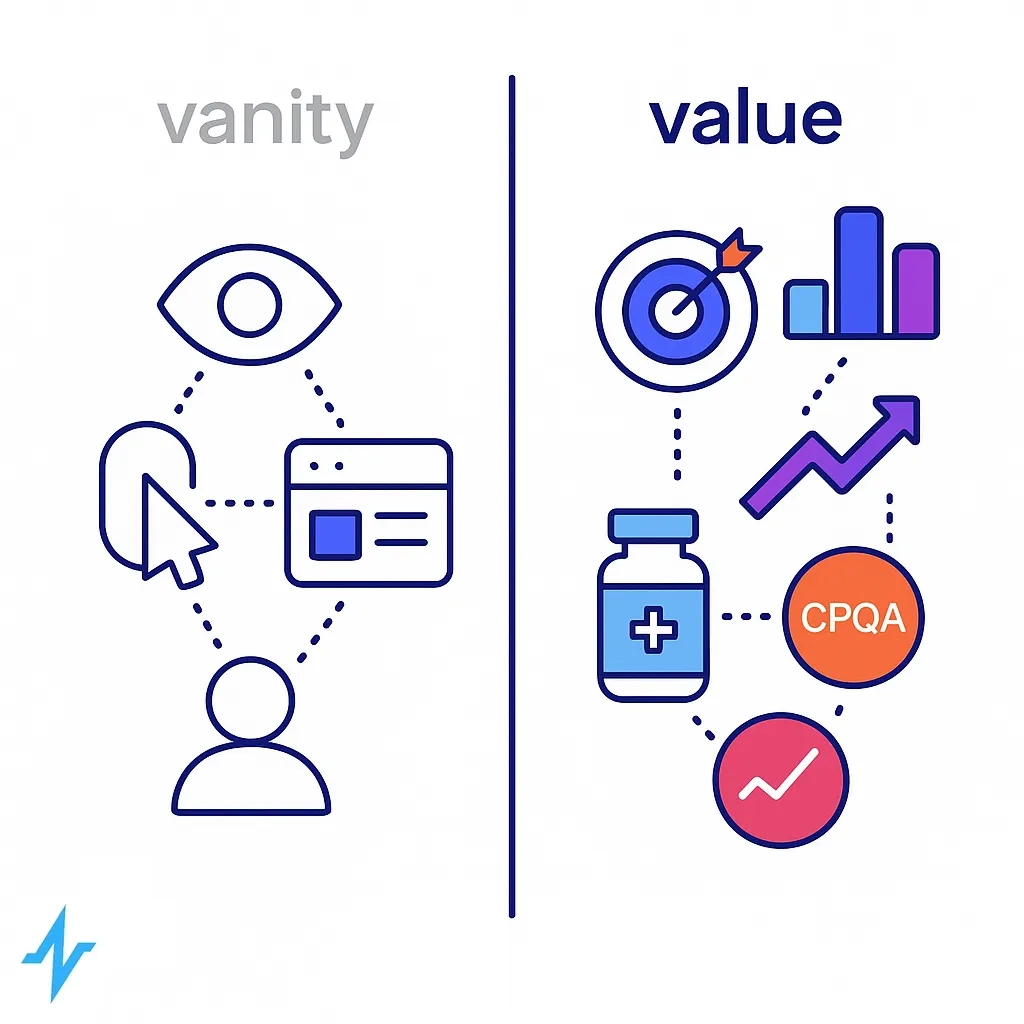
Vanity vs. Value (quick table)
| Vanity Metric | Why It Misleads | Value Metric | Why It Matters |
| Impressions | Reach with no quality | Qualified Reach | In-target + consented |
| CTR | Click ≠ clinical intent | OEQ | Weighted meaningful actions |
| Opens | Inflated, channel bias | Test-Lift | Causal impact on NBRx/TRx |
| Pageviews | Shallow | TtT & Persistency | Access & adherence bottlenecks |
| CPC | Price, not payoff | CPQA & LTV:CAC | Outcomes-level efficiency |
The Five Metrics (with formulas, sources, pitfalls, actions)
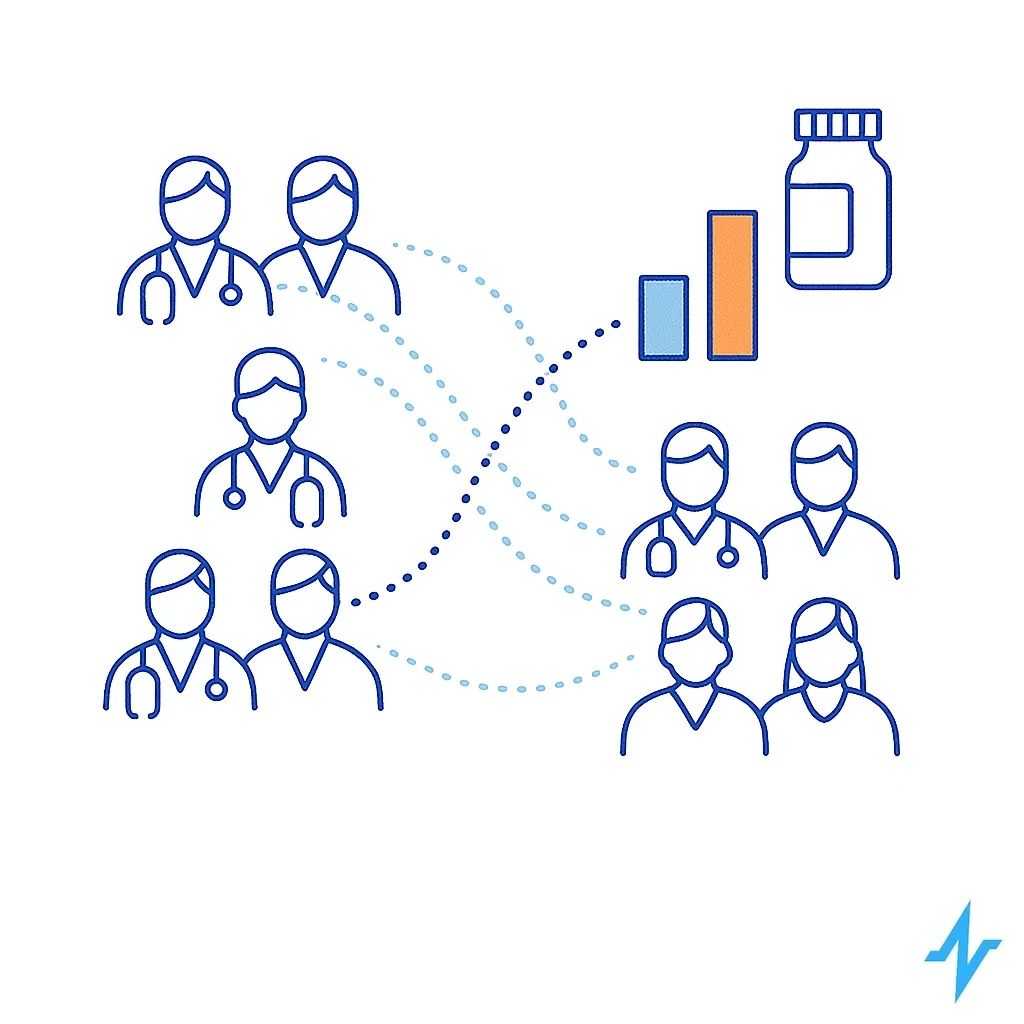
1) Qualified HCP Reach & Frequency (Top-of-Funnel Quality)
Definition
Unique HCPs within your target universe (by specialty/decile/territory/list) who received your message and were eligible to engage (consented & compliant), plus how often they were exposed.

Formula
- Qualified Reach = count(distinct HCP_ID) where in_target = TRUE AND consented = TRUE AND exposed = TRUE
- Effective Frequency Bands = 1–2, 3–5, 6–9, 10+
Primary sources
CRM activity logs, consent & preference center, DMP/identity graph, media platforms with HCP ID resolution, MDM target list.
Pitfalls
- Duplicated IDs across systems (MDM hygiene!).
- Counting non-permissioned impressions as “reach.”
- Over-frequency → fatigue → opt-outs.
Decisions it enables
- Close coverage gaps among priority specialties/deciles.
- Optimize frequency caps by channel and territory.
- Coordinate with field to avoid over-touching top deciles.
Formula card:
Qualified Reach Gap = (Target HCPs − Qualified Reach) ÷ Target HCPs
2) Omnichannel Engagement Quality (OEQ)
Definition
A composite, weighted score that favors interactions tied to real intent (e.g., content depth, read time, form submits, event attendance, next-best-action acceptance, rep-scheduled calls, sample requests).

Example weights (tune to your brand):
- Email read ≥ 8s → w=1
- Content scroll ≥ 60% → w=2
- HCP form submit (e.g., formulary check) → w=3
- Rep-scheduled call / meeting → w=4
- Sample request / starter enrollment → w=5
Formula
- OEQ per HCP = Σ(weight × qualified_event) ÷ total_exposures
- OEQ by Channel = average(OEQ per HCP within channel)
Primary sources
Web/app analytics (scroll depth, time), marketing automation, event platforms, CRM tasks/meetings, sample systems, hub signals.
Pitfalls
- Double counting the same intent (e.g., one action firing multiple events).
- Constantly changing weights — drift kills comparability.
- Over-reliance on a single channel’s signals.
Decisions it enables
- Promote high-yield content placements.
- Train next-best-action models on predictive actions, not clicks.
- Identify HCP cohorts with rising intent for coordinated field follow-up.
Formula card:
OEQ Lift = (OEQ_treatment − OEQ_control) ÷ OEQ_control
3) Incremental Rx Lift (NBRx/TRx) via Test-vs-Control
Definition
Causal impact of your tactic/campaign on new starts (NBRx) or total scripts (TRx), measured with holdouts or matched-market controls.
Approach
- Randomize at physician, territory, or geo level where feasible.
- Hold out comparable cohorts (by specialty/volume/payer mix).
- Align exposure windows with outcome lags.
Formula
- Lift % = (NBRx_test − NBRx_control) ÷ NBRx_control
- Add confidence intervals; require a minimum detectable effect.
Primary sources
Claims/longitudinal prescription data, SPP feeds, hub events, media exposure logs, field activity overlays.
Pitfalls
- Leakage between test/control (physicians crossing markets, spillover).
- Underpowered cells (sample size too small).
- Seasonality and access changes masking impact.
Decisions it enables
- Double-down on high-lift tactics; sunset low-impact channels even if cheap.
- Sequence touches (e.g., HCP video education before rep outreach) based on measured lift.
Formula card:
Incremental NBRx = (NBRx_test − NBRx_control) × population_size
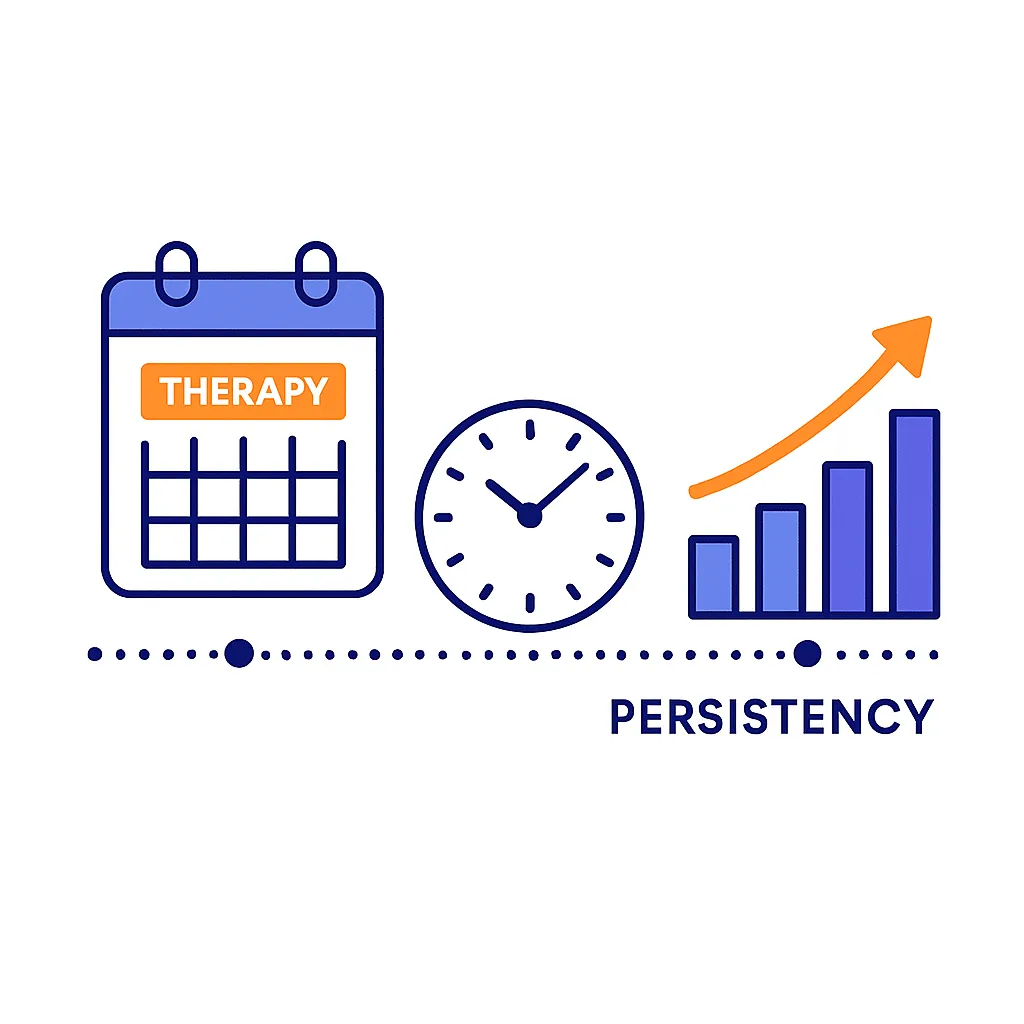
4) Time-to-Therapy (TtT) & Early Persistency
Definition
Time from an index intent signal (e.g., eRx, sample, rep education) to first fill, plus refill stickiness at 30/60/90 days.
Formulas
- TtT (days) = date(first_fill) − date(index_action)
- Persistency P30/P60/P90 = % of patients with fills at each interval
- Abandonment = eRx without first fill within X days
Primary sources
SPP/claims data, hub enrollment & copay program data, PA/benefit verification, CRM timestamps for education/samples.
Pitfalls
- Broken linkage between HCP action and patient outcome.
- Payer mix distortions (access varies widely).
- Ignoring pharmacy channel effects (retail vs specialty).
Decisions it enables
- Identify and remove bottlenecks (PA delays, copay shock).
- Optimize support sequencing (hub outreach, PA automation, copay messaging).
- Coach field teams on timing that reduces TtT and boosts early persistency.
Formula card:
Delta TtT = median_TtT_before − median_TtT_after (post-intervention)
5) Cost per Qualified Action (CPQA) & LTV:CAC
Definition
CPQA: Cost to produce an action that predicts Rx starts (e.g., rep follow-up booked, formulary check completed, sample requested).
LTV:CAC: Long-term value from a newly acquired patient relative to acquisition cost.

Formulas
- CPQA = total_spend ÷ # qualified_actions
- LTV:CAC = (patient_gross_margin × average_persistency − program_costs) ÷ acquisition_cost
Primary sources
Media spend and ops cost data, OEQ-defined actions, finance margin models, persistency curves from claims/SPP.
Pitfalls
- Declaring the wrong qualified action (choose ones tied to lift).
- Cross-channel apples-to-oranges (different payer mixes).
- Ignoring fixed program costs when comparing marginal channels.
Decisions it enables
- Shift budget toward channels with low CPQA and healthy LTV:CAC.
- Set stop-loss rules for tactics exceeding CPQA thresholds without LTV upside.
Formula card:
Qualified Action Rate = qualified_actions ÷ total_exposures
The KPI Spine: How These Metrics Roll Up
Think of your analytics as a single spine that connects reach → intent → impact → access → economics:
Qualified Reach/Frequency
↓
Omnichannel Engagement Quality (OEQ)
↓
Incremental Rx Lift (NBRx/TRx)
↓
Time-to-Therapy & Early Persistency
↓
CPQA & LTV:CAC (Outcomes Economics)
Design your dashboard around this flow. Each layer informs the next:
- If reach gaps exist, fix them before judging engagement.
- If OEQ is weak, improve content and next-best-actions before scaling spend.
- If lift is unproven, run holdouts.
- If TtT is slow or persistency poor, deploy access/support fixes.
- If CPQA is high and LTV:CAC weak, reallocate or redesign the tactic.

Data, Tech & Governance (Compliance-First)
- Consent & Preferences
Track opt-in growth, channel permissions, and decay. Build eligibility rules into activation and analytics. - PII/PHI Handling
Apply minimum-necessary access, de-identify where possible, maintain audit trails, and enforce role-based permissions. - MLR & PI
Version everything: claims language, references, content variants. Keep persistent links to full Prescribing Information. - Attribution Strategy
Blend test-vs-control (gold standard for causality) with MTA/MMM for coverage. Time-shift marketing inputs to outcome lags. - Integrations & Identity
Connect CRM, consent, media, web/app, event, hub, SPP/claims into a single ID graph. This is the backbone of the KPI spine.
Governance checklist (quick):

- Consent gating on all outreach
- De-ID for analytics where feasible
- Holdout design reviewed by analytics lead
- Data lineage documented in the dashboard
- PI/MLR references pinned to content versions
Three Mini Use Cases
1) New Indication Launch
Gap analysis finds only 54% of priority specialists are reached with ≥3 touches. After frequency tuning and KOL content, OEQ rises +28%. A holdout shows +11% incremental NBRx in treated territories. TtT cohorting surfaces PA delays; adding hub prompts trims median TtT by 4 days.
2) Brand Plateau
Clicks look fine, scripts don’t. OEQ reveals video education + rep follow-up is 3× more predictive than email alone. A geo test proves +7% NBRx lift for that sequence. CPQA drops 24% as spend shifts toward channels that generate qualified actions.
3) Access Friction
TtT analysis shows first-fill stalls at specialty pharmacies with high PA burden. Copay messaging and PA automation reduce abandonment by 8–10% and improve P60 persistency. Field teams time education to the benefit-verification window, reinforcing support.
How Pulse Health Helps
Unify the data. Pulse Health stitches HCP events, consent, and outcomes (hub/SPP/claims) into one ID graph, so your KPI spine is consistent end-to-end.


Measure what matters. Out-of-the-box templates compute Qualified Reach, OEQ, Lift, TtT/Persistency, and CPQA/LTV:CAC — with confidence intervals, cohorting, and territory rollups.
Act in real time. A next-best-action engine leverages OEQ to suggest the right content or rep follow-up and syncs audiences back to channels — guard-railed by consent.

Govern with confidence. Role-based access, audit trails, versioned content references, and configurable MLR-safe exports keep analytics compliant without slowing teams down.
KPI Starter Worksheet
| Metric | Working Definition | Example Formula | Primary Sources | Cadence | Owner | Watch-Out |
| Qualified Reach | In-target, consented HCPs exposed | count(distinct HCP_ID where in_target & consented & exposed) | CRM, Consent, Media/ID Graph, MDM | Weekly | Omnichannel Lead | ID duplication; over-frequency |
| Frequency Bands | Exposure intensity | Buckets: 1–2 / 3–5 / 6–9 / 10+ | Media logs, CRM | Weekly | Media Lead | Fatigue → opt-outs |
| OEQ | Weighted meaningful actions | Σ(weight × qualified_event) / exposures | Web/App, MA, Events, CRM | Weekly | Marketing Ops | Double-counting, weight drift |
| Incremental Lift | Causal Rx impact | (NBRx_test − NBRx_control) / NBRx_control | Claims/SPP, Hub, Media, Field | Monthly/Qtr | Analytics | Leakage; underpowered tests |
| Time-to-Therapy | Days to first fill | date(first_fill) − date(index_action) | SPP/Claims, Hub, CRM | Monthly | Patient Support | Broken linkage; payer distortions |
| P30/60/90 Persistency | Early stickiness | % patients with refills by day 30/60/90 | Claims/SPP | Monthly | Analytics | Channel differences |
| CPQA | Cost per predictive action | spend / # qualified_actions | Finance, Ops, MA | Weekly | Media/Finance | Wrong action definition |
| LTV:CAC | Long-term payback | (margin × persistency − program_costs) / acquisition_cost | Finance, Claims/SPP | Quarterly | Finance | Ignoring fixed costs |
Practical Tips to Operationalize
- Pick one North-Star KPI per quarter. E.g., Q1 = reach gaps, Q2 = OEQ uplift, Q3 = lift testing, Q4 = economics.
- Cohort everything. By specialty, decile, payer mix, territory, and channel sequence.
- Time-align rigorously. Marketing events and outcomes have lags; shift windows accordingly.
- Build stop-loss rules. If CPQA exceeds threshold without OEQ improvement in X weeks, pause.
- Make the dashboard conversational. Each tile should answer “What should we do next?”

Get Started with Pulse Today
When pharma teams focus on Qualified Reach, OEQ, Incremental Lift, TtT/Persistency, and CPQA/LTV:CAC, every decision gets clearer: where to find growth, what to scale, and which frictions to remove. These five metrics form a single KPI spine — from the first eligible touch to long-term economics — so your dashboards can finally drive outcomes, not just observations.

Want a quick read-out on where you stand?
Share your current KPIs and data sources, and we’ll map them to this framework and suggest the next three actions to move the needle — compliance-first.